Application Observability Concepts
Application observability is about aggregating, correlating and analyzing the following key elements:
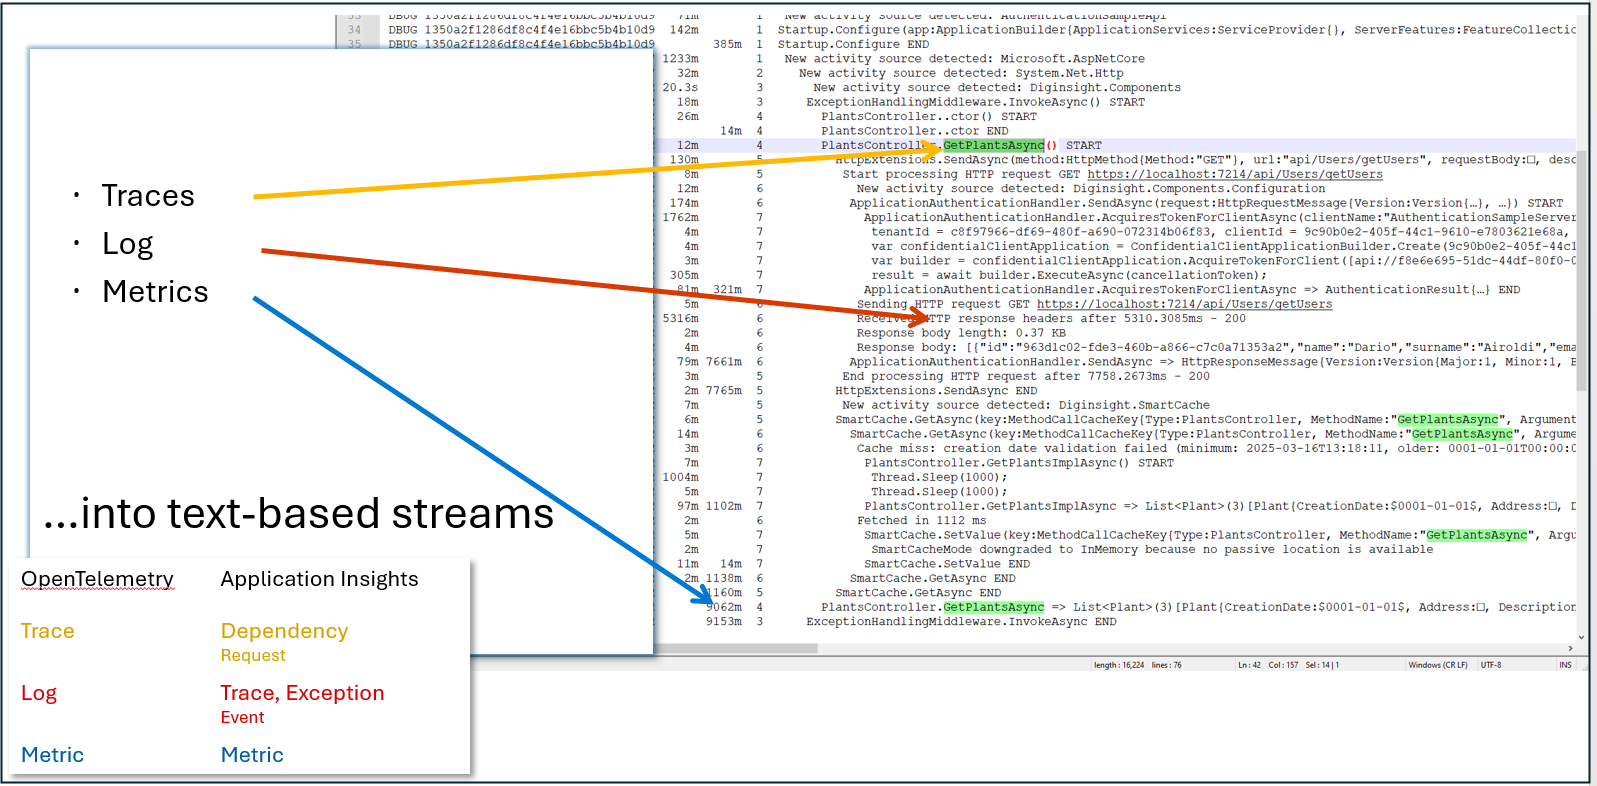
- Logs with application execution details and data.
- The requests and operations structure (sometimes also referred as Activity, Traces or Spans) with the structure of application calls, related to an event or exception condition.
- Metrics: numeric values (such as latencies, payload sizes, frequencies) that can be aggregated and correlated with the operations structure and the logs.
The image below shows examples about the 3 observability elements into local text based streams:
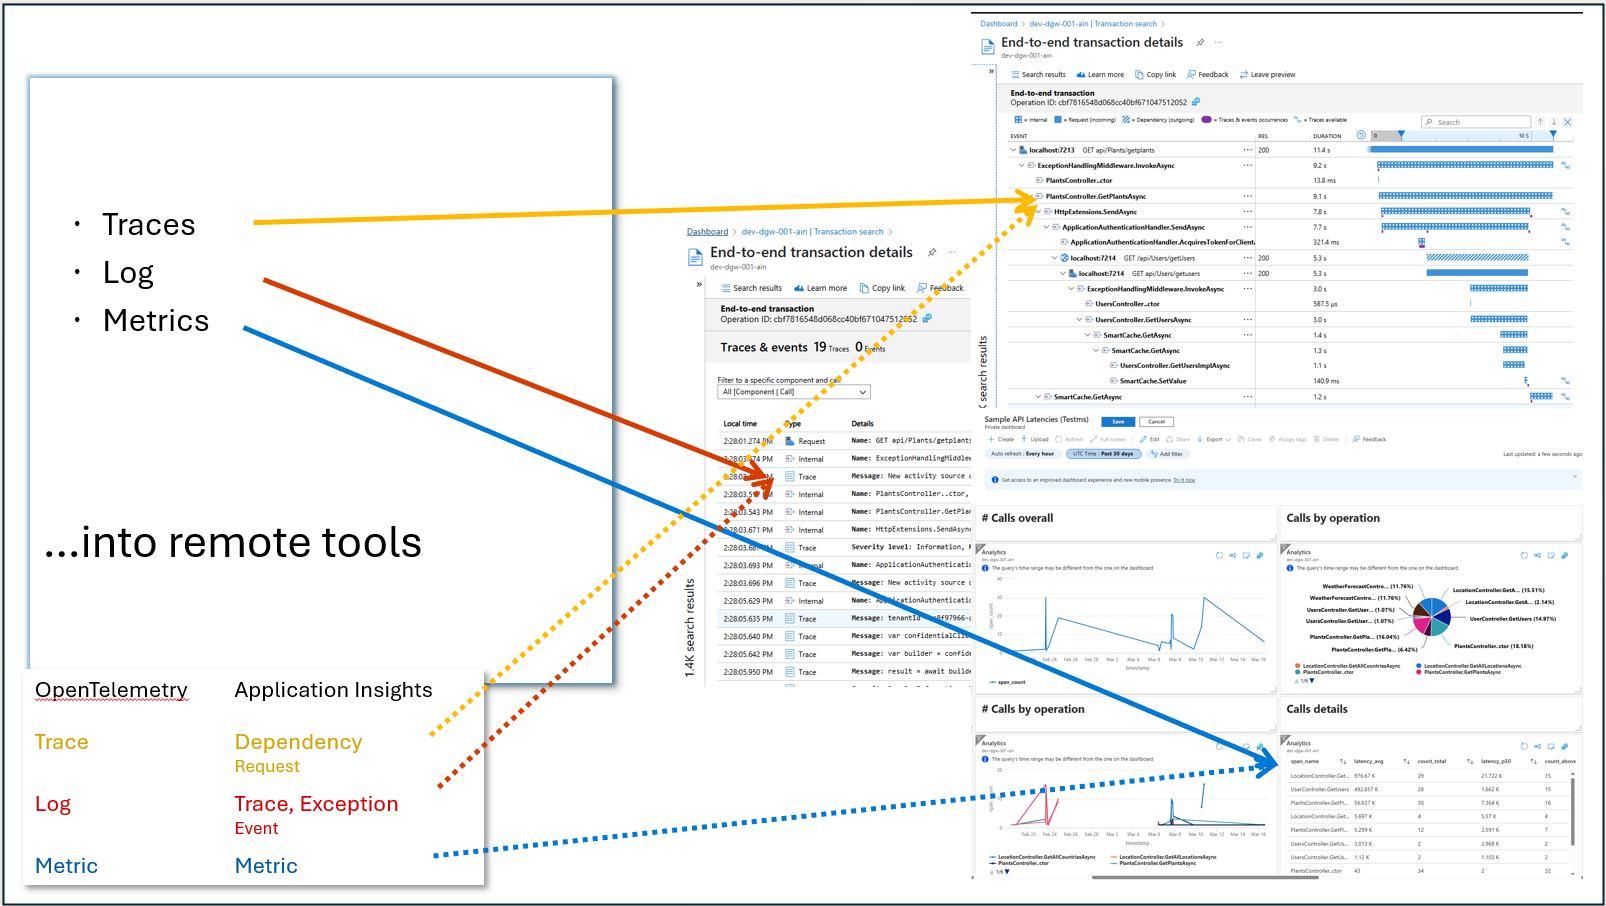
 The image below shows examples about the 3 observability elements into Azure Monitor Performance Management (APM) Tools:
Diginsight makes observability easy as:
>- it integrates the 3 observability elements (Log, Traces, Metrics) into high performance text-based streams such as traditional File logs, the Console log or the Azure Streaming log.
>- it publishes the 3 observability elements to OpenTelemetry and allowing application analysis by means of remote APM tools such as Azure Monitor and Grafana.
Additional Information
Application flow observability is provided leveraging existing .Net ILogger and System Diagnostics classes so that diginsight telemetry can be mixed and analyzed with other components telemetry, as long as they rely on the same standard framework classes.
Observability for remote tools is provided by means of OpenTelemetry so that telemetry data can be targeted to Azure Monitor and also other analysis tools such as Prometheus/Graphana.
Diginsight application flow rendering is: - consistent across tools: every information or metric visible on the local text based streams can be published and observed on the remote analysis tools (eg. on Appinsight Transaction detail or Appinsight Metrics). 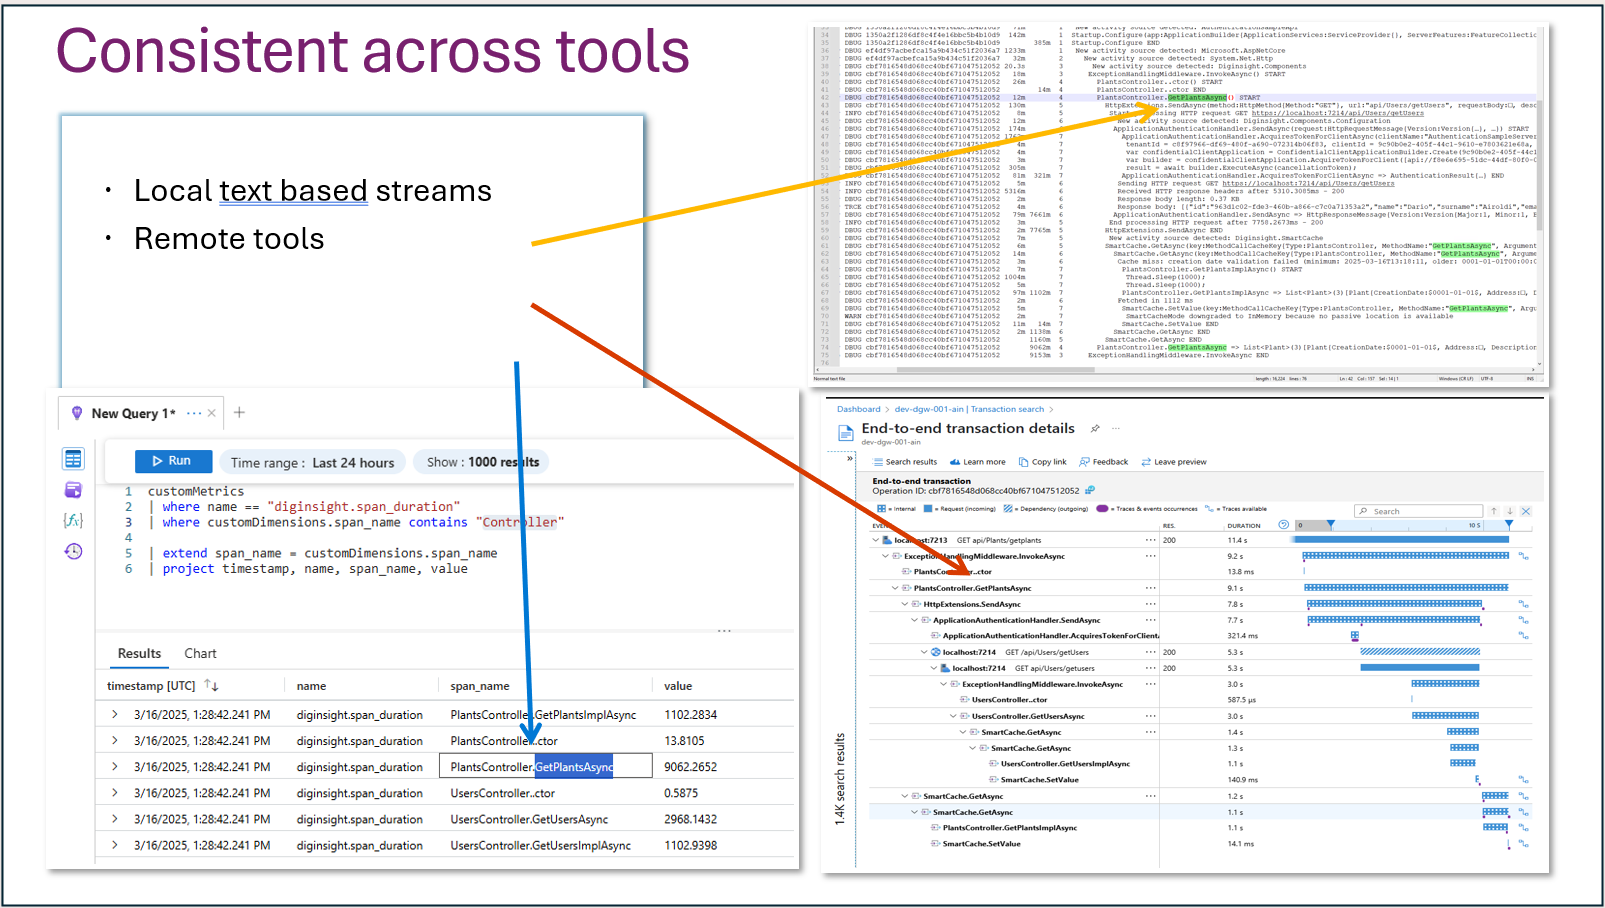
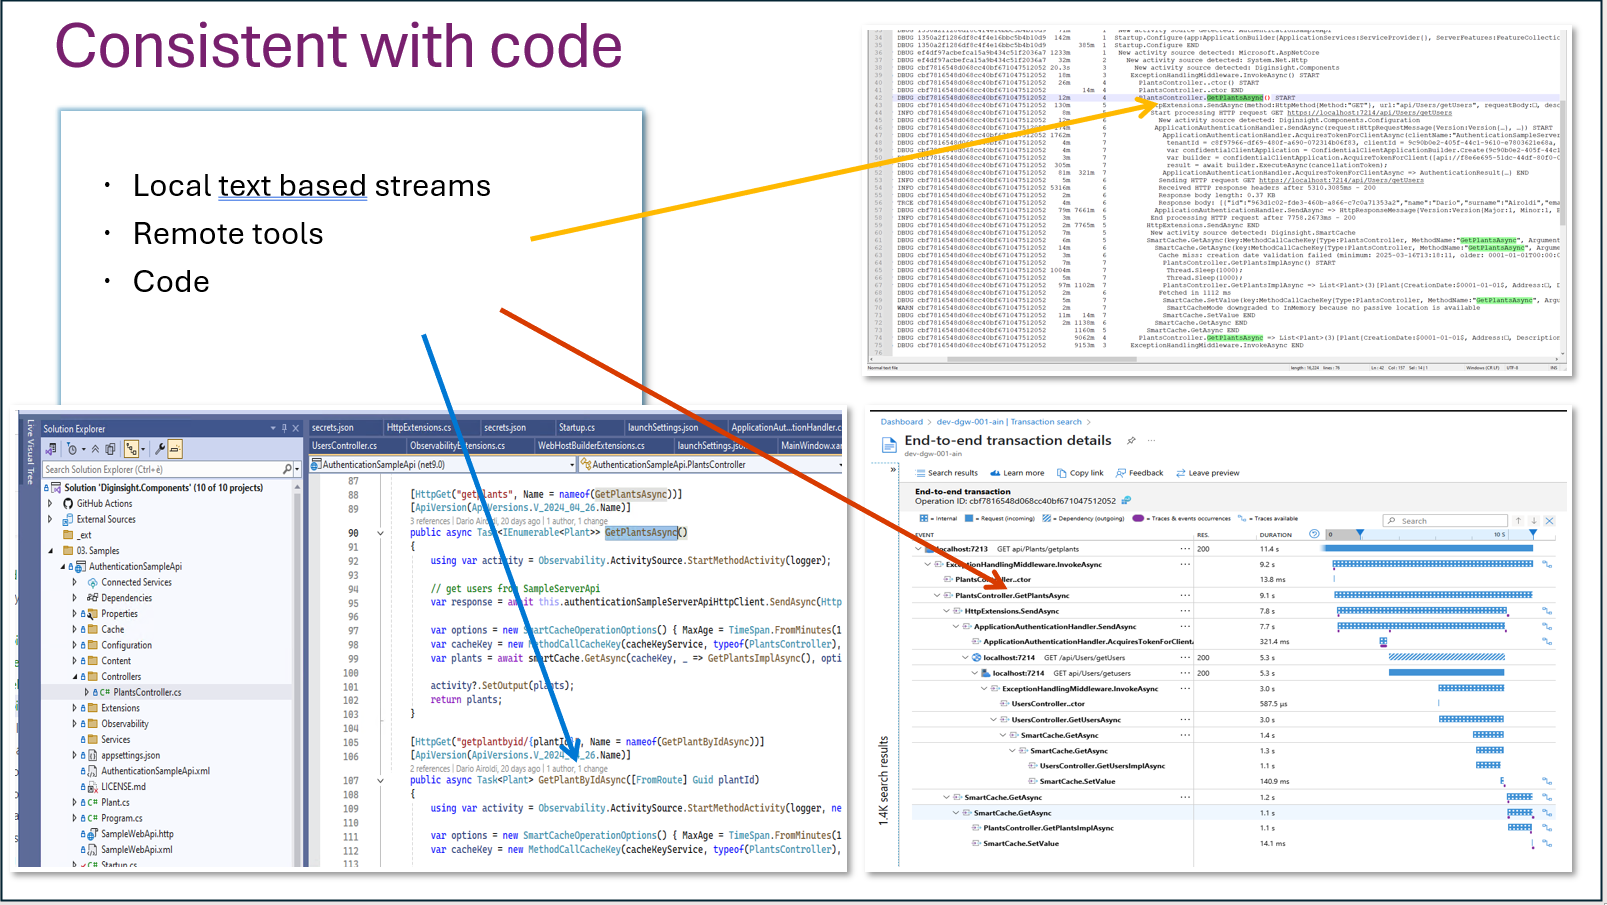
consistent with code: the application flow is published with information about classes, method names and call nesting so the ‘gap’ from telemetry and code is shortened for application developers and site reliability engineers.
consistent across applications application flow published in the same way for all applications. so it is easily readable for peopble without background knowledge on the application logic.

Diginsight log layout and automatic rendering for entities can be fully customized to ensure best readability of the application flow.
Paragraph Getting Started discusses basic steps we can follow to integrate diginsight telemetry.